Today’s businesses find it challenging to create web and mobile apps that users enjoy and understand. They often struggle to figure out what confuses or frustrates users, which can lead to low engagement and missed opportunities.
To fix this, businesses need a way to collect and understand detailed information about user interactions with their digital platforms. This is where a special method comes in that helps analyze how users use a site or app. This approach, called User Experience Data Analytics, gives businesses the insights they need to improve user satisfaction and achieve better results.
In this article we will learn about user experience data analytics, its importance, and how can you use it to improve conversion, and engagement, and to make informed business decisions. Let’s start with a definition.
What is User Experience Data Analytics?
User Experience Data Analytics means collecting and studying data on how people use a web or mobile app to make their (users’) experience better. It involves looking at various factors to understand user behavior, find problems, and discover ways to improve.
This process is all about figuring out how people interact with a product, by gathering data from things like surveys, usage stats, and data from different tools. By analyzing this data, we (marketers or businesses) can learn what works well and what doesn’t, which helps businesses make changes to improve the product and engage with customers better.
Key Parts of user experience data analytics:
- Data Collection: Collect information from user surveys, website stats, heat maps, session recordings, reports of various tools, and feedback forms.
- Data Analysis: Using techniques to understand user behavior, find issues, and measure satisfaction. This includes spotting trends, grouping users, and linking different data points.
- Insights Generation: Using the analysis to make smart decisions on how to improve the product or service for a better user experience.
- Implementation: Making changes based on the insights to enhance the product or service.
Why is it Important to Track User Experience (UX) Analytics Data?
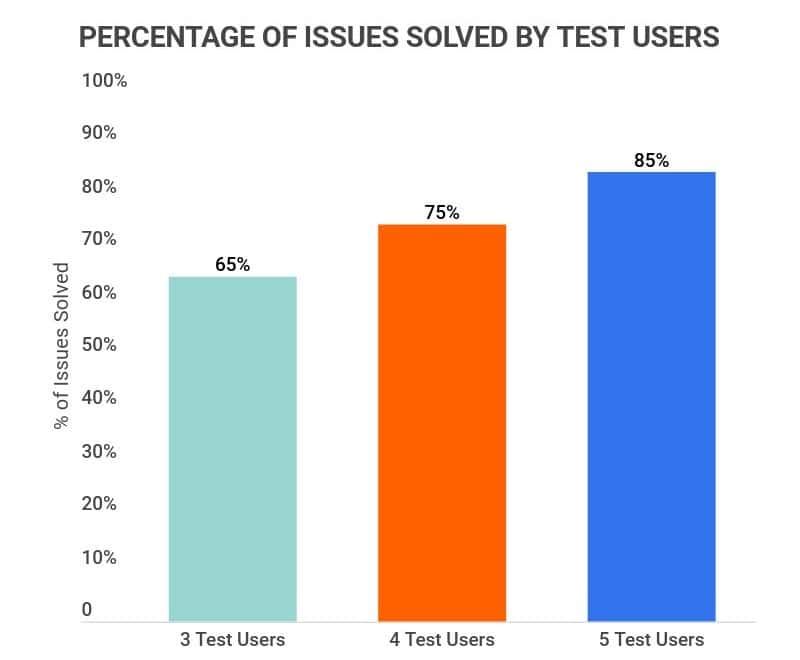
It has been observed that 55% of companies conduct user experience testing. For every dollar spent on improving UX, businesses can see a return of $100, resulting in a 9,900% return on investment (ROI). This demonstrates how crucial user experience is for business success and underscores its substantial impact on profitability.

User experience (UX) data analytics can guide a business on whether to spend more on marketing, improve infrastructure, fix or update features, or add new ones.
Here’s how different metrics can help:
- Response Time: If your website or app loads slowly, users might leave, and your search rankings could drop. Keeping load times fast is crucial.
- New and Returning Visitors: This shows how well you attract and keep users. If you’re not getting new visitors or keeping the old ones, you might need to rethink your marketing or product. For example, if users set reminders of upcoming offers, events and discounts in an app, whether he uses it frequently or not, he/she will open the app when app will remind him/her about that particular event or offer day. Making it easier to set reminders could boost retention.
- Session Length: This measures how long users stay on your product. A long session might mean users are engaged, but it could also mean they’re having trouble if they’re spending too much time on a task.
- Pages per Session: If users visit many pages, they might be engaged or struggling to find what they need. Reducing clicks to find information can improve the experience.
- Conversion Rate: Track the journey of a visitor from clicking ads to making a purchase or signing up. Adjusting messaging or onboarding can help improve conversion rates.
- Task Success Rate and Time on Task: These show how easily users can complete key tasks (navigate, placing an order, signup, form-filling, etc). If users struggle or take too long, it could lead to frustration. Making performing tasks easier and quicker can improve satisfaction.
- Engagement: This measures how often users engage with your product each month. Higher engagement means users are developing a habit of using your product.
- Navigation vs. Search Ratio: If users rely on search to find things, your product design might need to be more intuitive. Improving layout and navigation can make finding information easier.
- Feature Engagement Rate: This shows how often users use different features. If a feature isn’t used much, consider highlighting it more or removing it if it doesn’t add value.
- Net Promoter Score (NPS): This simple survey asks how likely users are to recommend your product. A low score means you need to make improvements.
- Customer Churn Rate:This metric measures the percentage of customers who stop using your website or leave a specific page over a given period. Tracking churn helps you understand and address the reasons why users might be leaving.
Getting all the above details can help you in:
- Understanding User Behavior: It helps you see how users interact with your product or service. Knowing which features they use most, where they struggle, and what they enjoy can guide improvements.
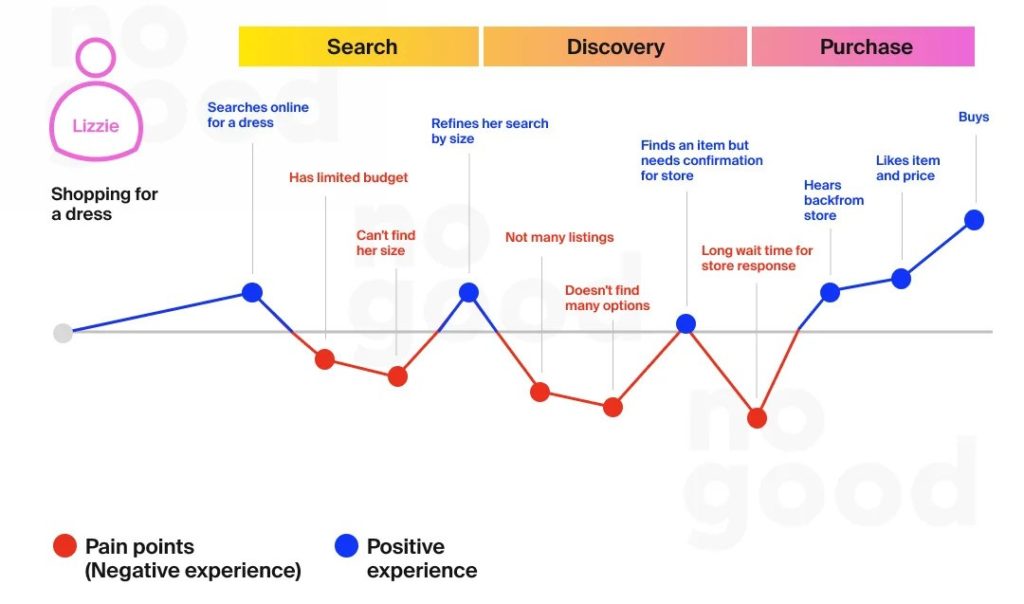
- Identifying Problems: Analytics can reveal pain points or issues in the user experience. For example, if users frequently abandon a checkout process, you can investigate and fix the problem.
- Improving Design: By analyzing user feedback and behavior, you can make informed design changes that enhance usability and satisfaction.
- Measuring Success: It allows you to assess whether recent changes or updates are effective. Tracking metrics before and after changes can show if they have improved the user experience.
- Optimizing Performance: Data helps identify areas where the product can be made more efficient or effective, leading to better performance and user satisfaction.
- Making Informed Decisions: Decisions based on data are more likely to lead to successful outcomes than those based on guesswork. UX analytics provide concrete evidence to guide decisions.
- Enhancing User Retention: Understanding and improving the user experience can lead to higher user satisfaction and retention, ultimately contributing to the success of your product or service.
Similarities and Differences Between User Experience Data and User Behavior Data
Since user behavior data is closely related to user experience data, it is important to understand the similarities and differences between these two terms.

Similarities Between User Experience Data and User Behavior Data
- Purpose: Both types of data aim to understand and improve user interactions with a product, service, or platform. They provide insights into user preferences, pain points, and overall satisfaction.
- Data Collection Methods: Both can be gathered through similar methods such as surveys, interviews, feedback forms, analytics tools, and tracking user interactions on websites or applications.
- Qualitative and Quantitative: Both can include qualitative data (like user feedback and comments) and quantitative data (like click rates, time spent on a page, or task completion rates).
- User-Centric: Both focus on the user’s perspective and are essential for creating a user-centered design and improving the overall user experience.
Differences Between User Experience Data and User Behavior Data
Here is a table outlining the differences between User Experience Data and User Behavior Data:
| Aspect | User Experience (UX) Data | User Behavior Data |
| Definition | Information about how users feel about and interact with a product or service, encompasses emotions, satisfaction, ease of use, and overall perceptions. | Tracking specific actions users take while interacting with a product or service, including measurable actions like clicks, navigation paths, and time spent on tasks. |
| Focus | Subjective aspects such as user satisfaction, emotions, and perceived usability. | Objective actions and patterns. |
| Data Types | Often qualitative, involving user surveys, interviews, usability testing, and direct feedback. Metrics like Net Promoter Score (NPS), System Usability Scale (SUS), and user satisfaction ratings. | Primarily quantitative, involving metrics like page views, click-through rates, session duration, bounce rates, and heatmaps. |
| Analysis | Analyzed to gain insights into user emotions and perceptions, identifying areas for emotional and experiential improvement. | Analyzed to understand usage patterns and optimize functionality, navigation, and efficiency. |
| Application | Used to enhance the overall user experience, and design decisions, and to align the product more closely with user needs and desires. | Used to improve usability, increase engagement, optimize workflows, and enhance performance. |
According to Full Story, 71% of leaders think it’s essential to understand how users interact with a digital product to make key business decisions. This shows that user behavior data is crucial for planning product strategies. However, there’s a problem: 65% of leaders struggle to act on these insights. This gap between recognizing the importance of user data and actually using it reveals a big opportunity for companies to improve.
However, in our case both types of data are important for enhancing user experiences. Experience data helps you understand how users feel, while user behavior data shows you how they act. Combining these insights can lead to better product strategies and improvements.
Quantitative vs Qualitative User Experience Data Analytics
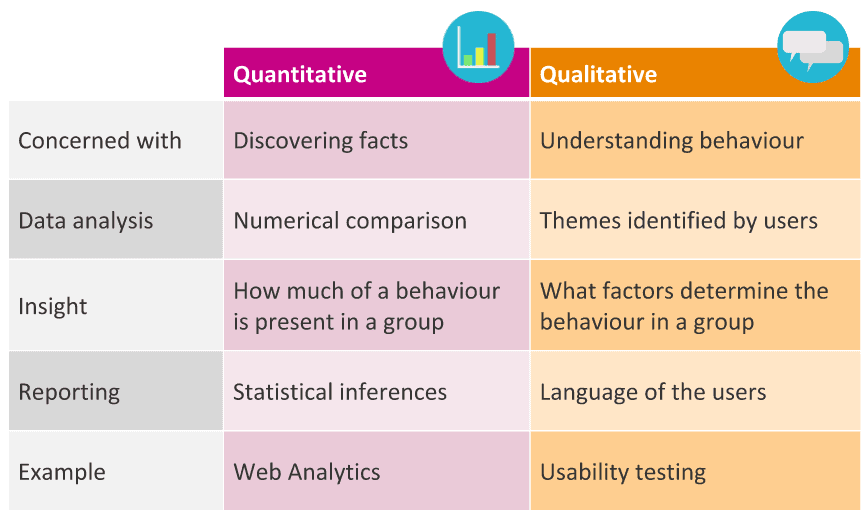
When researching users, there are two main methods: qualitative and quantitative. They work together and each provides unique insights.

Quantitative Analytics
This method uses numbers to measure user experiences. It can show if users are happy, unhappy, or neutral, but it doesn’t explain why they feel that way.
- Analyzing user interactions on websites: Tracking what users do on your site to understand their behavior.
- Heatmaps: Visualizing where users click, scroll, and hover on a page.
- Session recording: Recording videos of user sessions to see their interactions in detail.
- A/B testing: Comparing two versions of a page to see which one performs better.
- Funnel analysis: Tracking steps users take to complete a goal and identifying where they drop off.
- Cohort analysis: Grouping users by shared characteristics to analyze their behavior over time.
- Behavior flow analysis: Visualizing the paths users take through your site.
- Event tracking: Monitoring specific actions users take, like clicks or form submissions.
- Descriptive analytics: Summarizing data into key metrics like averages and medians.
- Predictive analytics: Using data to forecast future user behavior.
- Regression analysis: Understanding how changes in one variable affect another.
- Multivariate testing: Testing different combinations of page elements to find the best design.
Qualitative Analytics
This method explores the reasons behind user experiences. It helps product managers understand why users interact with a product in certain ways.
Popular Methods for Qualitative Analysis:
- One-on-One Interviews: Talking directly with users to get their feedback.
- Observing Users: Watching how users interact with the product through session recordings.
- Open-Ended Surveys: Asking users detailed questions to get deeper insights.
- Reviews and Feedback: Analyzing the reviews or asking them to share their views and opinion.
Using both data types helps you make informed design decisions, reduce user frustration, and create a better user experience.
Helpful Tools for User Experience Data Analytics
You will need the help of some tools to collect data, analyze it, make the required changes, and then check the result. Here are some useful tools.
Best User Experience Data Analytics Tools for Collecting and Analyzing Data
To collect data you need some tools. Choosing the right tools can make a big difference in understanding and improving user experience. Here are some popular options:
Google Analytics
About 28.1 Million Websites Use Google Analytics. Google Analytics or GA4 is a free tool that helps you understand how people use your website. It tracks a wide range of user behaviors, such as which pages they visit, how long they stay on each page, what links they click, and what actions they take. This information helps you see which parts of your website are working well and which areas need improvement.
Hotjar
Over 2,864,162 websites are using Hotjar worldwide. Hotjar combines several powerful tools to give you a complete picture of user interactions on your website. It offers heatmaps, which show where users click, move, and scroll on your pages. It also provides session recordings, allowing you to watch real user sessions to see how they navigate your site. Additionally, Hotjar includes surveys and feedback forms to directly ask users about their experience and gather valuable insights.
Crazy Egg
Crazy Egg is a tool that helps you understand how users interact with your web pages. It offers heatmaps to show where users click the most, scrollmaps to reveal how far users scroll down a page, and A/B testing to compare different versions of a page to see which one performs better. This information helps you optimize your site for better user engagement and conversion rates.
FullStory
FullStory provides detailed session recordings and analysis to help you understand user behavior in depth. By recording every user session, FullStory lets you watch how users navigate your site, where they encounter issues, and how they interact with different elements. This detailed insight helps you identify and fix usability problems, improving the overall user experience.
Mixpanel
Mixpanel focuses on tracking user actions and funnels to help you understand how users interact with your product. It allows you to track specific events, such as button clicks or form submissions, and see how users move through different stages of your site or app. This helps you identify where users drop off and how to improve conversion rates by making data-driven decisions.
How to collect and analyze User Experience Data?
The process of User Experience (UX) Data Analytics involves several steps, aimed at understanding how users interact with a product, website, or application to improve their overall experience. Here is a detailed breakdown of the UX data analytics process:
Defining Objectives and KPIs
Clearly define your objectives for UX analytics. The goals might include:
- Improving user satisfaction
- Increasing conversion rates
- Reducing churn
Our main aim is to understand the needs and pain points of your users and enhance their experience with your product.
Key Performance Indicators (KPIs) for achieving these goals:
- User engagement: Metrics like time on site, pages per visit, and bounce rate.
- Conversion rates: The percentage of users completing desired actions (e.g., signing up, making a purchase).
- Retention rates: Measure how many users return to the product over a specific period.
- Task success rate: The percentage of users who complete specific tasks.
Data Collection
Quantitative Data
This type of data is all about numbers and statistics. It helps us understand what is happening on our site or app.
- Web Analytics Tools: Website analytics tools, like Google Analytics, help you track user actions on your website. They show you which pages users visit, how long they stay on each page, and which links they click. This information helps you understand which parts of your site are popular and which may need improvement.
- Heatmaps: Heatmap tools, such as Hotjar and Crazy Egg, provide visual representations of where users click, move, and scroll on a webpage. They highlight the most popular areas of your site, showing you which parts attract the most attention and interaction.
- Session Recordings: Session recording tools, like FullStory, record user sessions, allowing you to watch how users navigate your site in real-time. You can see exactly how users interact with your site, where they encounter problems, and how they move from one page to another.
Qualitative Data
This type of data is more about feelings and opinions. It helps us understand why things are happening.
- Surveys and Feedback: Surveys and feedback forms are a direct way to ask users about their experiences on your site. By collecting their thoughts and feelings, you gain valuable insights into what users like and dislike, and what improvements they suggest.
- User Testing: User testing involves observing real users as they interact with your site. By watching how users perform tasks and where they struggle, you can identify pain points and areas for improvement. This hands-on approach provides deep insights into user behavior and usability issues.
- Interviews: You can talk one-on-one with users to get a deeper understanding of their behaviors and motivations.
Data Analysis, Identifying Insights and Patterns
Once you have collected user experience data, the next step is to analyze it to gain meaningful insights. Here’s how to do it:
Identify Patterns
Look for common behaviors and trends in the data. For example, are users leaving your site at a specific point? Are they spending more time on certain pages? Identifying these patterns helps you understand what parts of your site are working well and which areas need improvement.
Segment Users
Divide your users into groups based on their behaviors or demographics, such as age, location, or how they use your site. This helps you understand different user groups and their specific needs. For instance, younger users might interact differently with your site compared to older users. Create detailed user personas based on the data. These personas represent different types of users and their needs.
Compare Metrics
Use key performance indicators (KPIs) like conversion rates (the percentage of users who complete a desired action), bounce rates (the percentage of users who leave your site after viewing only one page), and task completion rates (how many users complete a specific task) to measure user experience. These metrics help you see how well your site is performing.
Qualitative Insights
Analyze user feedback from surveys and usability tests to understand the reasons behind certain behaviors. For example, if users leave your site quickly, feedback might reveal that they find the navigation confusing. This qualitative data provides context to the quantitative data you’ve collected.
Hypothesis Formulation and Applying Improvement
Based on your data analysis come up with hypotheses about how to improve the user experience. Rank these hypotheses based on how much impact they could have and how easy they are to implement.
Make Improvements
As per Forrester, companies that implement top design practices grow twice as fast as the industry benchmark growth rate.
So, use the insights gained from your analysis to make informed decisions about design changes, feature updates, or content modifications. For example, if users are having trouble finding information, you might redesign the navigation menu or make important links more visible.
Testing and Validation
- A/B Testing: See how changes affect users, test different versions of your product with a small group of users. This will help you measure which version performs better and make data-driven decisions.
- Usability Testing: Make sure the changes you’ve implemented have actually made the user experience better. This involves observing real users as they interact with your product to ensure that the improvements are effective.
- Metrics Comparison: Compare the key performance indicators (KPIs) from before and after making changes. This helps you confirm whether the changes had the desired impact and if they met your expectations.
Continuous Monitoring and Iteration
- Continuous Feedback Loop: Regularly gather and review user feedback and data to keep track of how users are interacting with your product. This helps you stay informed about user behavior and any emerging issues.
- Iterative Improvements: Make ongoing, small adjustments based on the data you collect. This means continuously refining and enhancing your product to provide a better user experience over time.
- Stay Agile: Be prepared to adapt your strategies as new insights come in or as user needs change. Flexibility allows you to quickly respond to feedback and keep improving your product.
The UX data analytics process is a repetitive and ongoing method that needs regular effort. By consistently gathering, analyzing, and using user data, organizations can create products that better meet user needs and keep improving the user experience.
Conclusion
Zippia found that 23% of people who’ve had a positive user experience share it with ten or more people. User Experience (UX) Data Analytics is essential for any business aiming to enhance how users interact with their products or services. By analyzing user experience and behavior data, businesses can identify problem areas, improve features, and enhance the overall user experience.
I hope this comprehensive article has provided you with all the details and guidance you needed. By continually analyzing and responding to user feedback and behavior, companies can stay flexible, meet user needs, build loyalty, and achieve long-term success.
Frequently Asked Questions
How often should I look at UX data?
You should check UX data regularly, like once a month or every few months. This helps you see how things are going and make changes based on what users are saying and how they’re interacting with your product.
What are some challenges in user experience data analytics?
Some challenges are understanding complicated data, making sure the data is correct, combining data from different sources, and using the data to make decisions that meet both user needs and business goals.
How does User Experience (UX) data affect SEO?
User Experience data impacts SEO by influencing metrics that search engines consider, such as bounce rate, time on page, and page load speed. A positive UX can lead to better engagement and higher search rankings.


