In today’s world, businesses rely a lot on data. People often think that having more data is better for making decisions.
But with so much data around, it can be hard to figure out what it all means. Usually, people use spreadsheets to organize data, but when there’s a ton of it, spreadsheets can’t handle it all.
That’s where free data visualization tools come in. These tools help turn boring numbers into colorful charts and graphs that are easy to understand. And the best part? You don’t have to pay a lot of money to use them. Even though there are fancy paid options, there are plenty of free ones that work just as well.
In this blog, we’ll talk about some of the best free data visualization tools. They’re great for small and medium-sized businesses, as well as regular people, who want to make sense of their data without spending a lot of money.
Whether you need charts, graphs, timelines, or dashboards, these data visualization tools can help you see your data in a whole new way.
Let’s explore the world of free data visualization tools and start making smarter decisions together!
What is Data Visualization?
Data visualization means showing information and data in a visual way, like charts or graphs, to make it easier to see patterns, trends, or unusual data points. Instead of looking at raw numbers, visualizations help us understand the data better.
![[your-subject] - EyeUniversal Data Visualization Tools](https://www.eyeuniversal.com/wp-content/uploads/2024/07/image.png)
Here are some examples of data visualization:
- Bar charts showing sales performance each month.
- Pie charts illustrating market share distribution among competitors.
- Line graphs showing the trend of website traffic over time.
- Scatter plots display the relationship between advertising spending and sales revenue.
- Heatmaps indicating customer engagement on different website pages.
Here are some main ideas about data visualization:
Types of Data Visualization:
- Charts: Line charts, bar charts, pie charts, and scatter plots.
- Graphs: Such as network graphs, flowcharts, and decision trees.
- Maps: Showing data on geographic maps.
- Dashboards: Interactive displays that combine several charts and graphs.
Categories of Data Visualization:
- Numerical Data: Showing numbers like sales revenue, temperature, or stock prices.
- Categorical Data: Representing groups or categories like product types, customer groups, or animal species.
Data visualization blends art and data science, making it a strong medium for understanding and sharing data.
Why do businesses need data visualization tools?
There are about 4.66 billion people using the Internet today, up from 2.6 billion in 2013. Each day, they generate an incredible 2.5 quintillion bytes of data.
By 2025, this amount is expected to skyrocket to 181 zettabytes. To give you an idea of how much that is, it’s 40 times more bytes than the number of stars in the observable universe. To filter, understand, manage, and analyze data, businesses need a hassle-free method and that’s where data visualization tools are needed.
Businesses need data visualization tools for several important reasons:
Decision-Making and Strategy
Visualizations help leaders make better decisions by showing complex data in an easy-to-understand way.
For example, they can help analyze sales trends, customer behavior, or supply chain efficiency—strategic planning benefits from visual insights.
A retail company, for example, can use a heatmap to see peak shopping hours and plan staff schedules accordingly.
Identifying Patterns and Trends
Visualizations reveal hidden patterns in raw data. Line charts, bar graphs, and scatter plots help track performance over time, compare variables, and spot trends.
For instance, a veterinary clinic can visualize patient visits by day of the week to optimize staffing.
Effective Communication
Visualizations make it easier to share information. Instead of a spreadsheet full of numbers, a well-designed chart can convey the same information more effectively.
Marketing teams can use visualizations to show campaign performance, conversion rates, and social media engagement.
Monitoring Key Metrics
Dashboards with real-time visualizations let businesses track important performance indicators like website traffic, revenue, customer satisfaction, or inventory levels.
A dairy farm can use visualizations to track milk production, feed consumption, and health metrics.
Identifying Anomalies and Outliers
Visualizations highlight unusual data points. For example, a sudden spike in website bounce rate or a drop in product sales can be quickly spotted.
An equestrian equipment manufacturer can detect irregularities in production output with visualizations.
Enhancing Data Literacy
Data visualization tools help employees become more comfortable with data and making data-driven decisions.
A pet food company can create interactive visualizations to educate customers about ingredients and nutritional content.
Storytelling and Persuasion
Visualizations tell a story. Compelling visuals engage the audience whether for a sales pitch, annual report, or marketing campaign.
A cat breeders association can use visualizations to showcase breed characteristics, lineage, and health statistics.
Choosing the right data visualization tool is important to get all the benefits, and the choice generally depends on factors like scalability, ease of use, integration capabilities, and cost.
Today, we are here with 12 free data visualization tools of 2024. These tools have been helping businesses for years and are ready to meet your data visualization needs.
12 free data visualization tools of 2024
Here’s a brief overview of the top 12 free data visualization tools along with their features and limitations:
Microsoft Power BI

Power BI is a business intelligence tool developed by Microsoft that allows users to create interactive reports and dashboards. It provides a cloud-based service that gives you a single view of your most critical business data.
Power BI is great for handling large amounts of business data, like customer information and financial records. It lets you connect to your data sources, create visualizations, and share useful insights.
Power BI offers many features, such as data integration, powerful analysis, and visualizations. However, it can be a bit complex and may require a strong technical background to use effectively.
With the right setup, Power BI can connect your entire organization. Besides the free version, the paid version costs only $10 per user per month, making it one of the most affordable data visualization tools.
Features:
- Can handle large amounts of business data
- Offers data visualization
- Reporting capabilities, and
- The ability to create dashboards.
Limitations:
- The free version has limited capabilities
- Not suitable for more intricate data projects.
Tableau Public

Source Marketing Campaign Performance Dashboard
Tableau Public is one of the best free data visualization tools that allows you to create, explore, and share data visualizations online. Users can create data visualization dashboards and can also import data from a spreadsheet or enter it manually. It provides a platform for users to publish interactive data visualizations to the web.
Once on the web, anyone can interact with the data, download it, or create their own visualizations.
Tableau Public also has a “Viz of the Day” feature that showcases data visualizations made by members of the Tableau Community.
Features:
- Supports publicly available data
- Offers an intuitive interface for creating interactive visualizations
Limitations:
- Only supports publicly available data.
- The visualizations are accessible by anyone on the internet.
- It also has limited data sources.
Google Looker Studio

Source Google search console report template
Previously called DataStudio, Google’s Looker Studio is a free data visualization tool using customizable charts and tables.
It makes sharing your insights easy and supports real-time collaboration. Built-in sample reports help you create reports quickly.
With Looker Studio, you can connect to various data sets like BigQuery, MySQL, PostgreSQL, Google Marketing Platform products, Google consumer products, CSV files, Google Cloud Storage, social media platforms, and more.
Features:
- Offers an easy-to-use drag-and-drop editor
- Ability to create fully customizable dashboards and reports.
Limitations:
- It may not blend data sources in a single view.
- Slow user interface may take longer to load.
Infogram Basic
Infogram Basic is another free data visualization tool that offers an easy-to-use web interface for creating interactive charts, maps, and infographics. It provides a platform for users to create interactive data visualizations with AI.
Infogram is an easy-to-use web tool for creating infographics and visualizing data. It has a simple interface that lets you create effective visualizations.
Infogram offers over 37+ types of charts and maps that you can customize to fit your business needs. They also recently added social media graphics and other visual elements.
You can use Infogram to create infographics, reports, slides, dashboards, maps, and social media visuals.
Features:
- Offers report templates
- Data connectors
- Report embedding.
Limitations:
- Free version of Infogram has limited capabilities.
Plotly
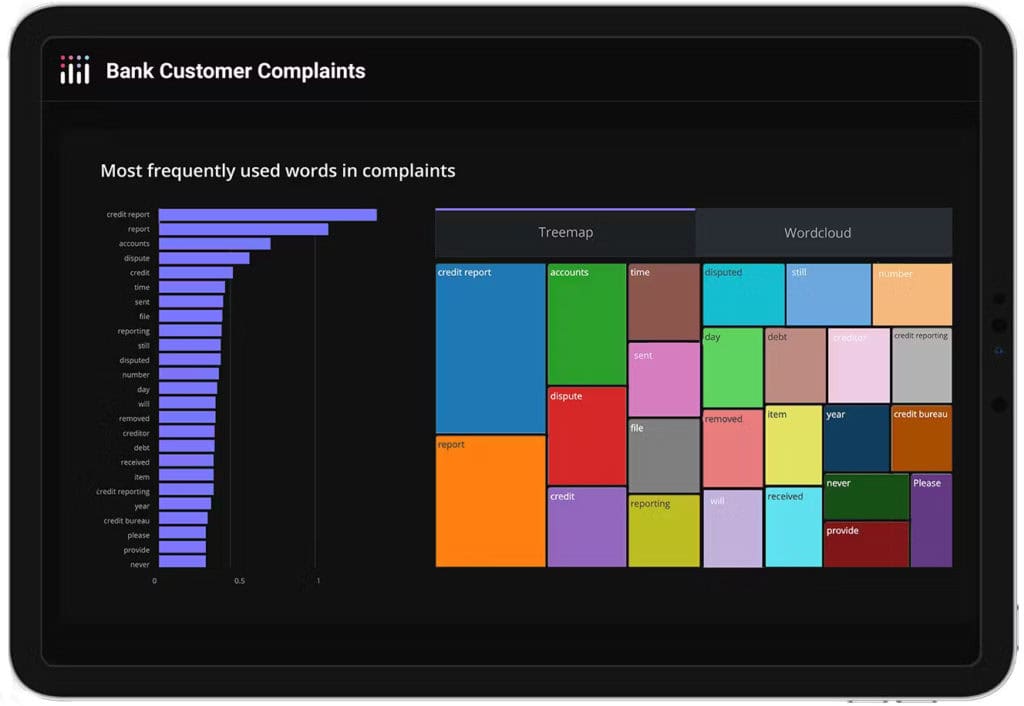
Plotly is an interactive, open-source, and browser-based graphing library that provides interactive and high-quality graphs.
It offers over 40 different chart types, useful for various fields like statistics, finance, geography, science, and 3D visualization.
Built on the Plotly JavaScript library (plotly.js), it lets users make beautiful, interactive, publication-quality visualizations for the web.
Plotly.js and Plotly for Python are free and open source.
Features:
- Offers Python-based charting with over 30 chart types
- Including scientific charts
- 3D graphs
- Statistical charts
- SVG maps
- Financial charts, and more.
Limitations:
- One of the main limitations is its performance with large datasets.
Leaflet
This tool isn’t for total beginners because it’s basically just a JavaScript library. You’ll have to add it to your own data visualization setup. But it’s famous for being really light (only 33 KB) and great for creating maps and interactive visuals for mobiles.
Even some fancy paid tools struggle with this, but not this one. So, if you’re okay with using the command line or making an API call, give Leaflet a go!
Features:
- Hardware acceleration on mobile
- Smart polyline/polygon rendering
- Customization Options
Limitations:
- Limited Offline Support
- Lacks built-in support for complex data visualization features
- Steep Learning Curve for Advanced Usage
Datawrapper
DataWrapper is a user-friendly, free data visualization tool designed for journalists, software developers, and other design professionals.
It provides excellent resources for creating a wide variety of beautiful charts, custom maps, and responsive tables.
The built-in design tools make customization easy, and you can easily share or print your charts.
With DataWrapper, you can create unlimited charts, maps, and tables, and even complete infographics that include text and images.
DataWrapper visualizations are designed to handle large audiences, supporting millions of viewers.
It offers ready-made templates and is especially popular with journalists. Many major media outlets like The New York Times, Deutsche Welle, Bloomberg, NPR, and Correctiv use it.
Features:
- User-friendly interface for creating interactive charts, maps, and tables.
- Users can easily share or print your charts.
- Can handle large audiences
Limitations:
- Datawrapper’s free plan is intended only for non-commercial use.
Google Charts
Google Charts lets you create custom and animated charts and tables, but you need to know how to code to make dashboards. If you don’t know coding, using Google Charts can be difficult.
It works with live data and outputs charts using HTML5 and SVG, so they run in browsers without extra plugins.
You can use data from sources like Google Spreadsheets, Google Fusion Tables, Salesforce, and other SQL databases.
It’s easy to embed a Google Chart on a website, and the data can be either static or dynamic, depending on the source.
Features:
- Offers a variety of charts.
- Output in HTML5 and SVG
- Offer animated charts and tables.
Limitations:
- The axis configuration options are limited
- The color bars are typically set automatically
- The chart plot size and line shape/weight often need to be improved in options.
OpenRefine
OpenRefine is a free, open-source desktop app for cleaning up messy data. It helps you understand a data set, fix any inconsistencies, and improve it efficiently.
OpenRefine works with tables, like spreadsheet programs, but has unique column-focused menus for viewing and refining your data.
It’s not meant for traditional data entry but is a powerful and flexible tool for various data-cleaning tasks.
Features:
- Desktop app
- Offers data cleaning,
- Transformation
- Reconciliation features.
Limitations:
- Only displays a limited number of rows of data at one time.
Visualize Free

Source Airport delay alerts example
With this tool, you simply upload your spreadsheet data and use drag-and-drop to create visualization dashboards.
You can share your private dashboards with others using a generated link. Visualize Free is a cloud-based, free data visualization tool for data visualization and analytics, requiring no client installation. It’s based on InetSoft’s commercial platform for dashboards, reporting, and data mashups.
Features:
- Cloud-based Platform.
- Offers basic dashboard, reporting, and data tools.
- Private dashboards can be shared with others
Limitations:
- To fairly distribute resources, data, and user privileges are limited.
Flourish
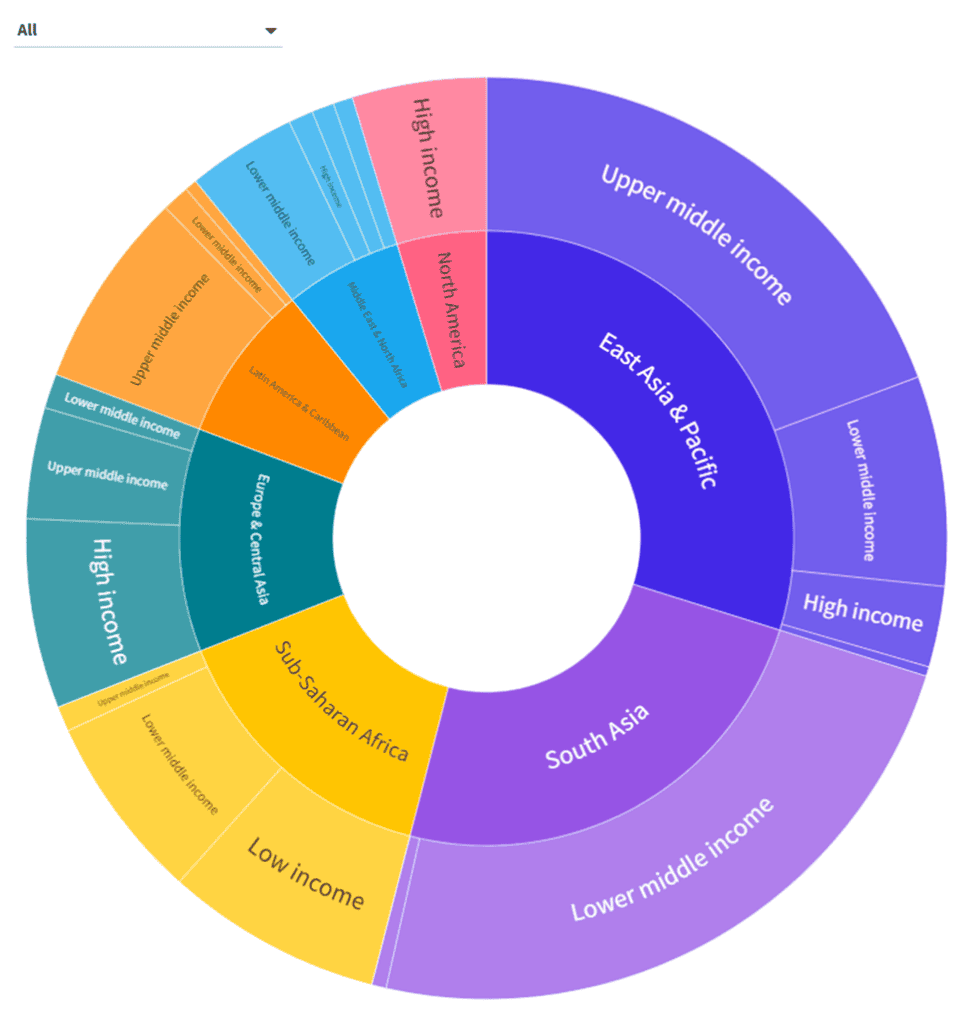
Flourish is a platform for making data visualizations and stories. It helps users create beautiful and interactive visualizations and animated data stories.
Flourish offers a variety of easy-to-use templates, including animated charts, detailed maps, and rich data explorers. It’s a great tool for non-coders, allowing them to create high-quality narrative visualizations like scrolly-telling, interactive presentations, and audio-driven stories.
Features:
- Offers a wide range of charts, maps, and tables.
- High-quality narrative visualizations
- Offer many templates
Limitations:
- Limited advanced analysis functions.
While these are some of the free data visualization tools, some of them offer additional features in their paid versions. So always check the official websites for the most up-to-date information.
Zoho Analytics
Zoho Analytics is a user-friendly data modeling tool that simplifies data analysis and visualization for businesses. It allows users to import, transform, and visualize data effortlessly.
Features:
- Easy data import from multiple sources
- Intuitive drag-and-drop interface
- Custom data model creation
- Automated data blending
- AI-powered insights
- Collaborative sharing options
- Robust security measures
- Integrations with Zoho and third-party tools
Limitations:
- May require time to learn advanced features
- Some features are available only in higher-tier plans
- Limited offline functionality
Conclusion
We hope this article on free data visualization tools was helpful. While all these tools are highly efficient, choose one based on the types of visualizations you need, your long-term business goals, website design, data type, and what your visitors prefer.

